← 목록으로

We’re introducing SynthID Bio, bringing our watermarking technology to synthetic biology.

We’re introducing SynthID Bio, bringing our watermarking technology to synthetic biology.

요약

Google DeepMind introduces SynthID Bio to watermark AI-designed proteins while maintaining biological function. Read the full research report here.

본문

We’re introducing SynthID Bio, bringing our watermarking technology to synthetic biology.

Sep 30, 2026

Today, we’re introducing SynthID Bio, a new technology that watermarks AI-designed proteins while preserving their biological function.

SynthID Bio embeds an imperceptible, verifiable watermark directly into biological designs, such as AI-generated protein sequences and predicted 3D structures.

In laboratory tests across target proteins, our watermarked designs successfully matched the performance and natural diversity of unwatermarked versions. This creates a vital provenance layer to strengthen biosecurity and preserve the integrity of open scientific databases.

You can read the full blog post and research on the Google DeepMind website.
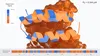
A 3D visualization of a molecular protein structure highlighting a watermarked sequence. The main background features a brown molecular surface representation, with two helical structures in the foreground color-coded along their ribbons in shades of orange and blue. A legend in the top left indicates "Watermark Signal," ranging from "Strong" represented by blue to "Weak" represented by orange. In the top right corner, the affinity constant is written as $K_D = 0.344,\mu\text{M}$. At the bottom, a color-coded amino acid sequence bar labeled "Watermarked Sequence" is shown with residue index markers from 6 to 56.1

Visualization of the predicted structure of our watermarked VEGF-A protein binder with watermark signal indicated by color for each amino acid.
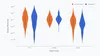
Here is alt text describing the image: A violin plot comparing the Binding Affinity ($K\_d$) values for three target proteins—PD-L1, SC2RBD, and VEGF-A—across non-watermarked (orange) and watermarked (blue) conditions. The y-axis represents binding affinity on a logarithmic scale from $10^{-5}$ to $10^{-10}$. Across all three target proteins, the distributions of binding affinity values are nearly identical between the non-watermarked and watermarked datasets.

Binding affinity, measured as KD, comparing non-watermarked and watermarked protein designs across three targets. Lower indicates stronger binders.
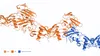
On 7PPA, we show the AF3 predicted structure (left), the ground truth structure (middle), and the watermarked structure (right).

On 7PPA, we show the AF3 predicted structure (left), the ground truth structure (middle), and the watermarked structure (right).

← 목록으로